Showing posts with label thread dump. Show all posts

Monday, March 24, 2014

Thread Dump Analysis


Dear WebLogic users/Administrator you might already visited many other sites that discussed about - how to take the thread dump. But here I am going to tell you about automation script makes more simplified way of working, with more information - almost 70% on the occasion of STUCK thread Thread dumps will reveals. In case of High CPU utilization situations, which method is badly working.

Step by Step analysis for Thread Dump


Step 1: Automated Thread Dump for WebLogic

Take the Thread dump for a managed server that have issues or slowness or latency etc. You just read the description and start applying to your test environment and then try out on your Live environments. Cheers!
#!/bin/bash

# This script will takes the managed server name as argument and it will work generic to Linux or SunOS or HP-UX.
# The only ps command options varies for each platform
# Kill -3 command used for every 10 seconds of interval. You can increase the number of dumps in the for loop

WL_SERVER=$1
OSENV=`uname`

   case $OSENV in
      Linux)WLSPID=`ps auxww|grep weblogic|grep -v grep|grep $WL_SERVER | awk '{print $2}'`;;
      SunOS)WLSPID=`/usr/ucb/ps -auxww|grep weblogi[c]|grep $WL_SERVER | awk '{print $2}'`;;
      HP-UX)WLSPID=`ps -efx|grep -v grep|grep weblogic|grep $WL_SERVER | awk '{print $2}'`;;
   esac
   if [ ! -z "$WLSPID" ]; then
      for i in 1 2 3 4 5
      do
         echo "Generating thread dump number $i in logs/${WL_SERVER}_stdout.log"
         jstack  $WLSPID >> /log/${WL_SERVER}_stdout.log
         sleep 10
      done
   else
      echo "Error!!! process id not found for $WL_SERVER"
   fi

Step 2: Start analizing Thread dump

Take the sed sword into your hands !! sed UNIX utility will give you the right way of using regular expressions to expose desired outputs. The following is more effective script for you, love it share it :)
# Script Name: ThreadAnalizer.sh
# Description: Pass the threa dump log file name as argument to this script it will show you the required lines that need to see 
# Regular expression pattern is applied for search in the log file.
clear

for i in `egrep 'trying to get lock|waiting to lock' $1 |  sed -n 's/.*[<@]\(.*\)[>[].*/\1/p' | sort | uniq`
do
 # Under that above line you will look thru the log for locked or holding lock
    sed -e '/./{H;$!d;}' -ne 'x;/ locked/{;/'${i}'/p;};/Holding lock/{;/'${i}'/p;}' $1
done
Look for more deeper with the handy utility that uses python. The following script can work to convert the given decimal number to hexadecimal number.
USAGE="Usage: $0 {number}"
if [ ! $# == 1 ]; then
  echo $USAGE
  exit
fi
 
python -c "print hex($1)"
exit 0

The following script can work to convert the given decimal number to hexadecimal number.

If you want to generate a separate thread dump file with prstat, pstack commands output it will be much wise. Everything in single file to analysis at the time of critical situations. Ofcourse it happen only in UNIX environments :).

WebLogic Application performance problems: Diagnosing

The following presentation will take you to understand with a clarity on OOME types and what are all the reasons. It also address the High CPU issues.
Write a comment what do you thing on this issues. Happy trouble shooting!!!

Tuesday, August 13, 2013

Why long way for thread dump on UNIX/Linux machines? Easy Steps!

jps - Java process list : Java Utilitycommand 

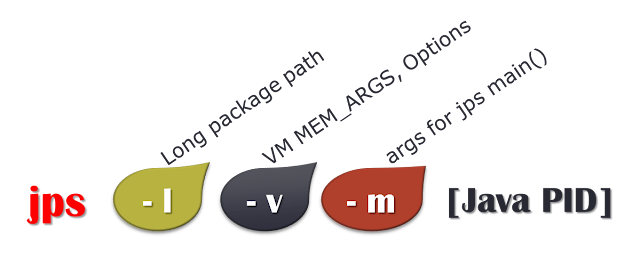
I was looking for diagnostic ways with freely available tools from JDK then I found the great valuable command tool 'jps'. The jps command can be used with three options(l, v, m). it can work for any Java - JEE Servers such as WebLogic, WebSphere, JBoss, Tomcat. In other words, any app server that uses the latest JDK 5+ version (version 6, 7, 8 also supports). Let me walk-through those interesting options in Win and *nix platforms. Before you execute this command tool, make sure that JAVA_HOME\bin is in the PATH setting.
Java Command tool : jps options

jps Option : jps -l

this -l option will give the full Java package name that invoked the Java process.
C:\Users\pavanbsd>jps -l
9116 sun.tools.jps.Jps
8812 weblogic.Server
Filtering the weblogic instance with find command on jps will give you the desired outcome.
C:\Users\pavanbsd>jps -l |find "weblogic"
8812 weblogic.Server

jps -v

this -v option is most important for tracking WebLogic, this option gives you the JVM aguments used to invoke the JAVA process (weblogic.Server). Usually for our WebLogic what we set in the setDomainEnv.sh will appear with this option.
C:\Users\pavanbsd>jps -v |find "weblogic"
8812 Server -Xms256m -Xmx512m -XX:MaxPermSize=128m -Dweblogic.Name=adm_clstr_dom -Djava.security.policy=C:\Oracle\MIDDLE
~1\WLSERV~1.3\server\lib\weblogic.policy -Dweblogic.ProductionModeEnabled=true -da -Dplatform.home=C:\Oracle\MIDDLE~1\WL
SERV~1.3 -Dwls.home=C:\Oracle\MIDDLE~1\WLSERV~1.3\server -Dweblogic.home=C:\Oracle\MIDDLE~1\WLSERV~1.3\server -Dweblogic
.management.discover=true -Dwlw.iterativeDev=false -Dwlw.testConsole=false -Dwlw.logErrorsToConsole=false -Dweblogic.ext
.dirs=C:\Oracle\MIDDLE~1\patch_wls1036\profiles\default\sysext_manifest_classpath

jps -m

this -m option will gives you the Java main() programs command line arguments that used by Java process.
 
C:\Users\pavanbsd>jps -m
8812 Server
8984 Jps -m

The problem of finding Java PIDs

Of course, you can kill the instance in the emergency in the same way this is quicker than regular ps command. Usually, WLA uses the following command for finding the WebLogic managed server process:
ps -fu username

Scanning that process list with your eyes for WebLogic start process, then its child process finally java process in that process list. the whole process looks hectic when there are many WebLogic instances running on the same machine. Sometimes killing wrong process makes nonsense/messy. To avoid such collisions in the decision of killing process best way is using 'jps'.

Try it and know about it then you can enjoy working with it...

Another problem area that will do pain for Middleware admins is that Find is the NodeManager is running or not on a machine (Win/*nix)? the best option I have simply types 'jps' it will give the desired result. Here I found the simple way for taking thread dump with JDK tools which work on the UNIX machine and also in Windows. Assuming that you WLA(WebLogic Admin) are aware of which WebLogic instance needs to take Thread-dump for analysis of an issue. The best option which I use that makes it very easy to do so is the java process in a UNIX box is :
$ jps -lv |grep WL_instancename

This will give you the process id and long view of JAVA_OPTIONS assigned to that instance. Pick that first number (Java PID) and use your regular kill -3 on it :)

The jps command as Troubleshooting helper

The jps command can be used to pipe out the PID for thread-dumps and memory/heap-dumps or Generation wise footprint with the following JDK commands utilities:

  • jstat 
  • jstack
  • jhat 
  • jdb
  • jmap
  • jinfo
  • jvisualvm
  • jconsole

Count WebLogic Servers using jps


Basically while working on Produciton environments, there would be WebLogic server bounce required while doing Application release or some patching happen on some of the middleware architecture components. Sometimes you may need to know how many WebLogic instances are running in that Unix machine or how many left for bounce. Simply you can use our free 'jps' command as shown below
 $jps |wc -l


If you wish to see only java process you can use simply jps command.
$jps


We can use for the WebLogic 9.x 10, 11g versions managed instances for thread dumps or terminating the process.

The same trick will work for all Oracle Fusion Middleware Infrastructure using services such as Oracle Analytics Server (OAS) domain, Oracle Data Integrator (ODI) domain, Oracle Business Intelligence Enterprise Edition (OBIEE), Oracle APEX domain, Oracle SOA Suite, Oracle Service Bus (OSB) domain, OUD, OIM and may more.

Note:
1. This command is available in JDK version 1.5 onwards only.
2. Careful while using long view it shows full details.

Blurb about this blog

Blurb about this blog

Essential Middleware Administration takes in-depth look at the fundamental relationship between Middleware and Operating Environment such as Solaris or Linux, HP-UX. Scope of this blog is associated with beginner or an experienced Middleware Team members, Middleware developer, Middleware Architects, you will be able to apply any of these automation scripts which are takeaways, because they are generalized it is like ready to use. Most of the experimented scripts are implemented in production environments.
You have any ideas for Contributing to a Middleware Admin? mail to me wlatechtrainer@gmail.com
QK7QN6U9ZST6